Overview
Each Cora Orchestration application (ADDS, BRS, JES, Administration, portal, WebApi) comes with a set of files that enable you to configure observability behavior like how and where to write the logs, how to count metrics, what to trace etc.
The observability configuration files are located in the ~/Configuration folder.
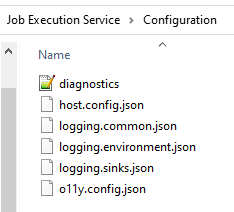
Following is the list of configuration files in the Configuration folder:
| File | Description |
|---|---|
| diagnostics.config | Sets the diagnostic sources configuration. |
| host.config.json | Sets the host configuration. |
| logging.common.json | Sets the general logging configuration. |
| logging.environment.json | Sets the logging environment specific configuration. |
| logging.sinks.json | Sets the logging output configuration. |
| o11y.config.json | Sets the observability configuration. |
Host configuration (host.config.json)
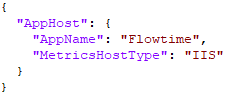
- AppHost.AppName: configures the application name that is automatically added to each log entry.
- AppHost.MetricsHostType: defines how to serve /api/metrics endpoint.
Values:- None: metrics not enabled
- IIS: serve with IIS site
- OwinSelfHost: serve with new web server
- OwinJesHost: serve with JES existing web server

General logging configuration (logging.common.json)
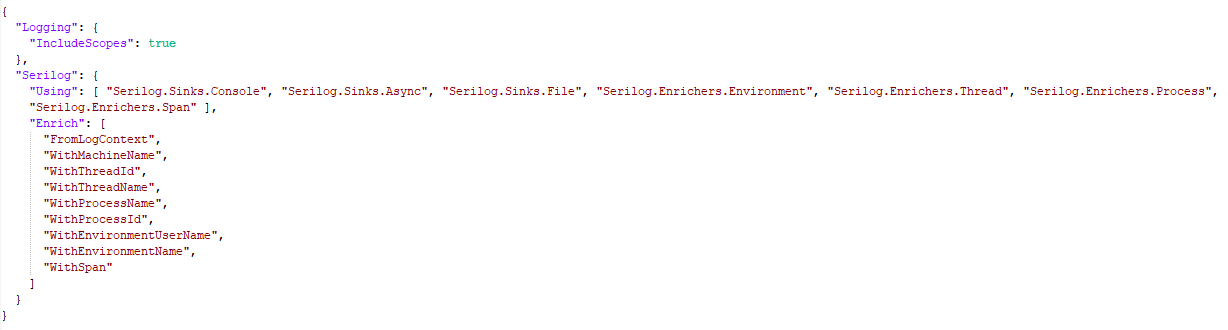
- Serilog: It is the third-party library used to write logs.
For more information about Serilog, see this link. - Sink: It is the method used by Serilog to write the log to any storage like files, cloud, API, Database etc.
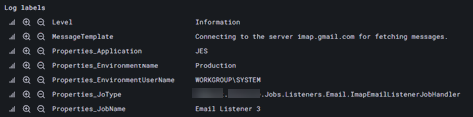
For more information about sinks and a list of supported values, see this link. - Enricher: It is the process that Serilog uses to format or decorate log entry. You need to add information like process name, machine name etc.
For more information about enricher and a list of supported values, see this link. - Serilog.Using: It defines an array of Serilog enabled sinks and enrichers.
- Serilog.Enrich: It defines an array of Serilog enabled enrichment capabilities.
Logging environment configuration (logging.environment.json)
Log level
Following are the possible log levels:
- Verbose: It is the noisiest level that is rarely enabled for a production app.
- Debug: It is used for internal system events that are not necessarily observable from the outside.
- Information: It indicates the events that describe things happening in the system.
- Warning: It indicates the warnings that occur when a service is degraded, endangered, or may be behaving unexpectedly.
- Error: It indicates the errors within the system when a functionality is unavailable or expectations broken.
- Fatal: It is the most critical level that indicates the events that demand immediate attention.
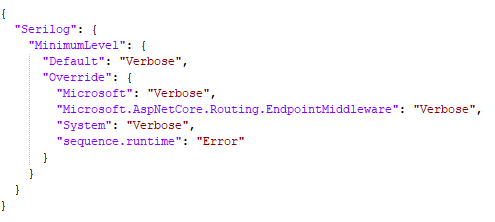
Serilog.MinimumLevel.Default
It defines the default log level for all sources.
Serilog.MinimumLevel.Override.XXXX
It defines the log level for specific diagnostic source. XXXX is the diagnostic source name from diagnostics.config.
Logging Sinks Configuration (logging.sinks.json)
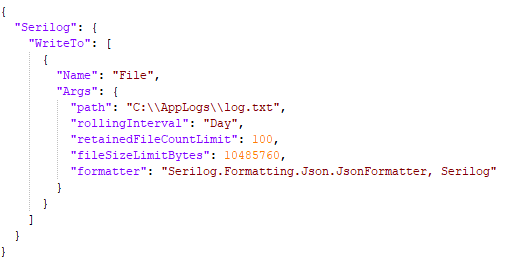
Serilog.WriteTo: It is a collection for Serilog sinks configurations, and must have at least one configuration.
By default, Cora Orchestration provides two kinds of sink configurations:
- VM: It uses File sink, and writes log files into C:\AppLogs folder.
- K8S: It uses Async Console sink, and outputs logs to container console.
Diagnostic Sources (diagnostics.config)
Each application, ADDS, BRS, JES, Administration, portal, WebApi, comes with predefined diagnostic sources configuration. Diagnostic source is on application-level implementation of the logging kinds that allows to categorize different logs, such as runtime logs, and authorization logs.
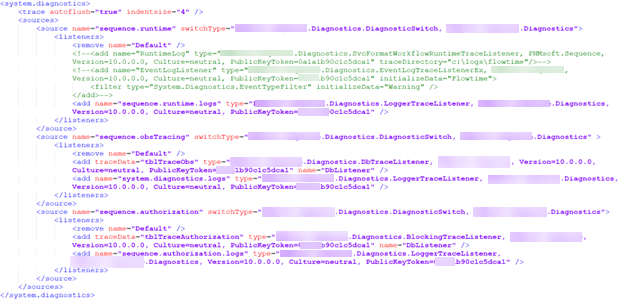
This configuration is predefined for Kubernetes and VM usages per Cora Orchestration applications, and you don't need to make changes to it, but for backward compatibility commented sections still exist.
For example, in the above screenshot you have two commented sections, SVC and EventView loggers.
More info about diagnostic sources and logging capabilities, see this article.
Observability configuration (o11y.config.json)
Observability configuration is split into two parts, Tracing, and Metrics. While in general both configuration sections look very similar but are different.
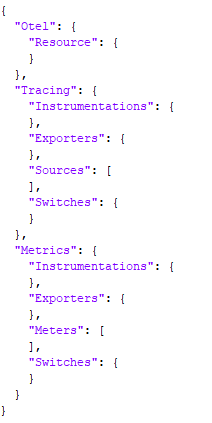
- Instrumentations: This section allows to configure various kinds of capabilities provided by observability instruments.
- Exporters: This section allows to configure where and how the data (traces/metrics) will be delivered.
- Sources: This section exists only for tracing and allows to register custom instrumentations that are not part of default observability package.
- Metrics: This section exists only for metrics, and allows to register all custom metrics that are not part of default observability package.
- Switches: This section allows to turn on & off specific instrumentations and exporters.
Tracing Configuration
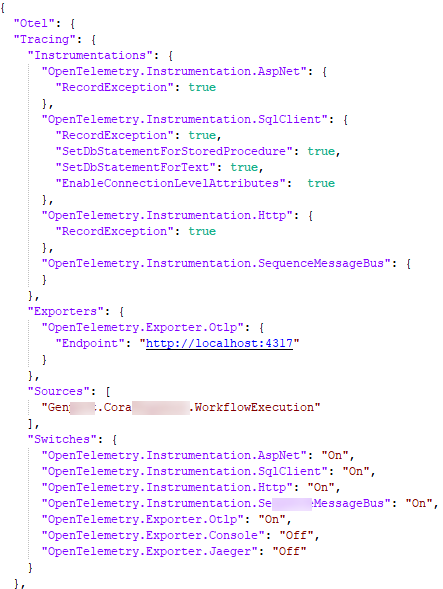
Tracing.Instrumentations.OpenTelemetry.Instrumentation.AspNet: Instrumentation responsible to trace Asp.Net requests.
For more info, see this link.
Tracing.Instrumentations.OpenTelemetry.Instrumentation.SqlClient: Instrumentation responsible to trace MS SQL Server queries and calls. For more info, see this link.
Tracing.Instrumentations.OpenTelemetry.Instrumentation.Http: Instrumentation responsible to trace all outgoing HTTP requests.
For more info, see this link.
Tracing.Instrumentations.OpenTelemetry.Instrumentation.SequenceMessageBus: Instrumentation responsible to trace Message Bus events. It is an In-house custom implementation, and there is no additional configuration yet.
Tracing.Exporters.OpenTelemetry.Exporter.Otlp: Trace exporter endpoint configuration via OpenTelemetry protocol (OTLP).
For more info, see this link.
Tracing.Sources: Registration of all custom tracers that has been implemented in the application.
Tracing.Switches: Key value configuration to turn on or off specific instrumentation or exporter. The key is the instrumentation/exporter name and value options are On or Off.
Metrics Configuration
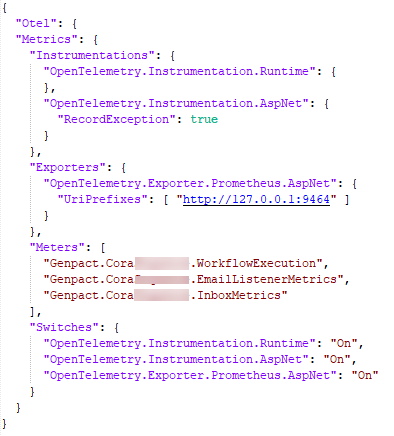
Metrics.Instrumentations.OpenTelemetry.Instrumentation.Runtime: Instrumentation responsible to measure runtime metrics, such as CPU, memory, used objects etc.
For more information, see this link.
Metrics.Instrumentations.OpenTelemetry.Instrumentation.AspNet: Instrumentation responsible to measure Asp.Net metrics, such as request time, response size etc.
For more information, see this link.
Metrics.Exporters.OpenTelemetry.Exporter.Prometheus.AspNet: Metrics exporter endpoint configuration for Prometheus scrapping.
For more information, see this link.
Metrics.Meters: Registration of all custom metrics that been implemented in the application.
Metrics.Switches: Key value configuration to turn on or off the specific instrumentation or exporter. The key is the instrumentation/exporter name and value options are: On or Off.
