Starting with V10.0, Cora SeQuence has been renamed to Cora Orchestration.
Overview
Observability refers to the ability to understand and analyze the internal behavior of the system based on its external behavior. It involves collecting and analyzing data from various sources in and use this data to understand its performance, identify issues, and make improvements.
In Cora Orchestration, observability is highly relevant in the context of Kubernetes. Observability helps monitor and gain insights into complex Kubernetes clusters.
Following are the three key pillars of Cora Orchestration observability:
- Logging: Records and displays all the events, errors, and activities that occurs within the system. This record helps in diagnosing system issues and understanding system behavior.
- Metrics: Collects and aggregates numerical data to analyze system's performance, such as response time, throughput, error rates, and resource utilization. With metrics you can quantify the system's behavior over time and identify anomalies, if any.
- Tracing: Captures and correlates individual requests or transactions flowing through the system. It provides a detailed view of requests propagation across different components, which in turn enables you to identify bottlenecks, latency issues, or errors.
With observability you can proactively detect, understand, and resolve issues, achieve faster debugging, and have improved system performance and user experiences.
Observability tools
To achieve observability, the system uses various tools and techniques such as log aggregators, metrics collectors, distributed tracing frameworks, and centralized monitoring platforms. These tools gather and consolidate data from different sources, allowing users to, gain insights into system behavior, troubleshoot issues, and optimize performance.
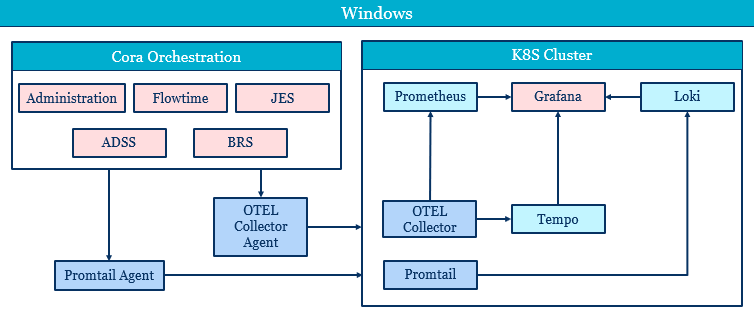
- Grafana: It is an open source UI platform to consume different data sources and visualize logs, traces, and metrics. It supports a wide range of data sources, including popular databases such as Prometheus, InfluxDB, Elasticsearch, and Graphite, as well as cloud-based services like Amazon CloudWatch and Google Cloud Monitoring.
For details, see this link. - Loki: It is a horizontally-scalable log aggregation system storage. It is designed to work with Promtail and Grafana. It allows users to store and query log data from various sources, using a custom indexing and storage format that is optimized for efficiency and scalability. Loki supports various log formats and provides features such as log searching, filtering, and alerting.
- Tempo: It is a a distributed tracing backend that allows users to collect, store, and query distributed traces from applications and microservices. It is designed to work with Prometheus and Grafana. Tempo is based on the Jaeger tracing technology and supports the OpenTelemetry standard for instrumentation.
- Prometheus: It is an open-source toolkit for monitoring and observing applications and infrastructure in a highly dynamic and distributed environment, and store metrics data. It is designed to work with Grafana. It evaluates the metrics data in real-time and trigger alerts when certain conditions are met. It comes with a powerful and expressive query language PromQL, which allows users to query, aggregate, and analyze the collected metrics data and perform operations like filtering, grouping, and mathematical calculations.
- Promtail: It is a log shipping agent that allows users to collect and ship logs from various sources, such as applications, containers, and system logs, to a centralized log storage system. It is designed to work with Loki. Promtail supports various log formats and provides features such as log tailing, filtering, and sampling.
- OpenTelemetry (OTEL) Collector: agent to collect telemetry data. It is an open source project that provides a vendor neutral way to collect, process, and export telemetry data from various sources. It is a flexible and customizable tool that can be used to collect telemetry data from multiple sources, including metrics, traces, and logs.
