v8.4 and earlier
The Operations Manager uses the HotOperations portal to allocate work between teams. For the Operations Manager, the HotOperations portal includes several sub-pages.
Dashboard
The Dashboard page includes relevant charts and analytics for teams' work performance, and includes the following visuals.
| Visual | Description |
|---|---|
| SLA Compliance | Number of cases that were completed on time, divided by the total number of cases. Displayed as a percentage. |
| Base and Actual Cost | Cost per case, based on the default operation setting (base), and the actual cost per case derived from the team utilization. |
| Team Utilization | How much effort is allocated to a team versus the team's monthly capacity. This is based on the value of the scmCaseEffort parameter. |
| Open Work |
|
| Work Closure Rate | Number of tasks closed every day from the beginning of the period, by category.
|
| Amount of Work Completed versus Overdue | For each day from the beginning of the time period, displays the number of cases that were closed on time versus tasks that were closed after the due date. |
| Teams Leagues Table | Displays information for each team member.
|
Work Allocation Page
Operations managers use the Work Allocation board to allocate cases between teams in real-time. To allocate work, drag-and-drop cases from the Unallocated Work panel to the necessary Team queue, or from team to team. When you drag a case to a different queue, an Impact window appears, which details the allocation impact on business outcomes, such as Cost and SLA. With these tools, Operations Managers can make informed decision on how to allocate case work between teams and people, which reduces the cost of work and improves business outcomes.
Tip: We recommend that you manage less than 25 teams on the Work Allocation page. Managing more cases might affect performance. If you need to manage more teams, use the Cases List or Tasks List.
| Visual | Description |
|---|---|
| SLA Compliance | Number of cases that were completed on time, divided by the total number of cases. Displayed as a percentage. |
| Base Cost | Cost based on the number of hours it should take to complete all cases for the month. |
| Predictive Cost | The predicted cost per month if teams continue to work on the current workload. |
| Teams Workload | The percentage that each team is utilized for case work, out of their available monthly work hours. |
Tasks List Page
Operations Managers use the Tasks List page to view a list of dynamic tasks for a solution, and to allocate one or more tasks in the operation.
Click the three dot button next to a task to view available actions.
You can sort the tasks list columns:
- Ascending: click the column once.
- Descending: click the column twice.
- Remove sort: click the column three times.
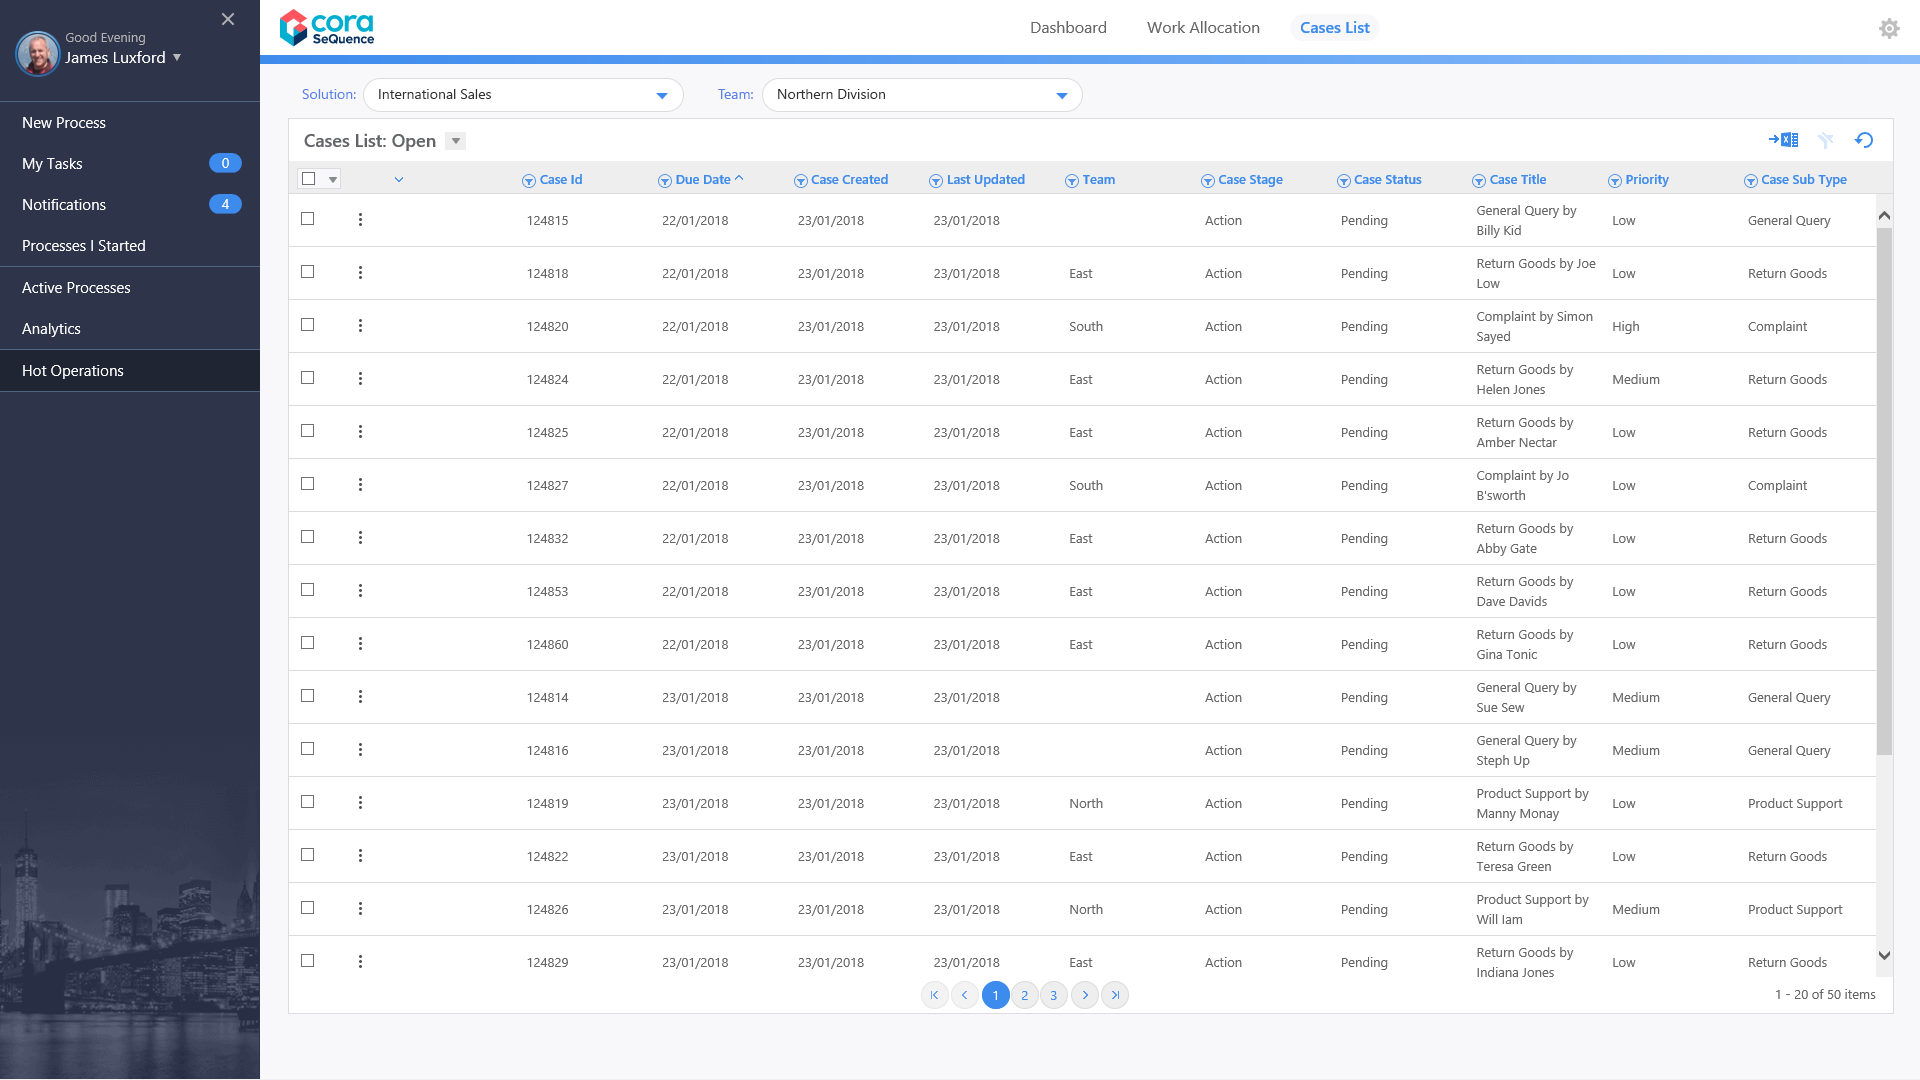
Cases List Page
Operations Managers can view a list of all cases and allocate those cases from the Cases List page. We recommend using the Cases List page when managing high volumes of cases.
v8.5
Overview
The Operations Manager uses the HotOperations portal to allocate work between the amalgamation of the sub-groups and teams for the group that they are defined as the HotOperations Manager for. You can define an Operations Manager for every group level, not just the root group.
Let's use a sample organization to understand. This organization has four main groups (Engineering, Human Resources, International Sales, and Marketing), each of which have sub-groups. For our example, we will use the International Sales group (root group). Below the root group are two sub-groups, International Region A and International Region B, each of which have two regional sub-groups (North-South, East-West).
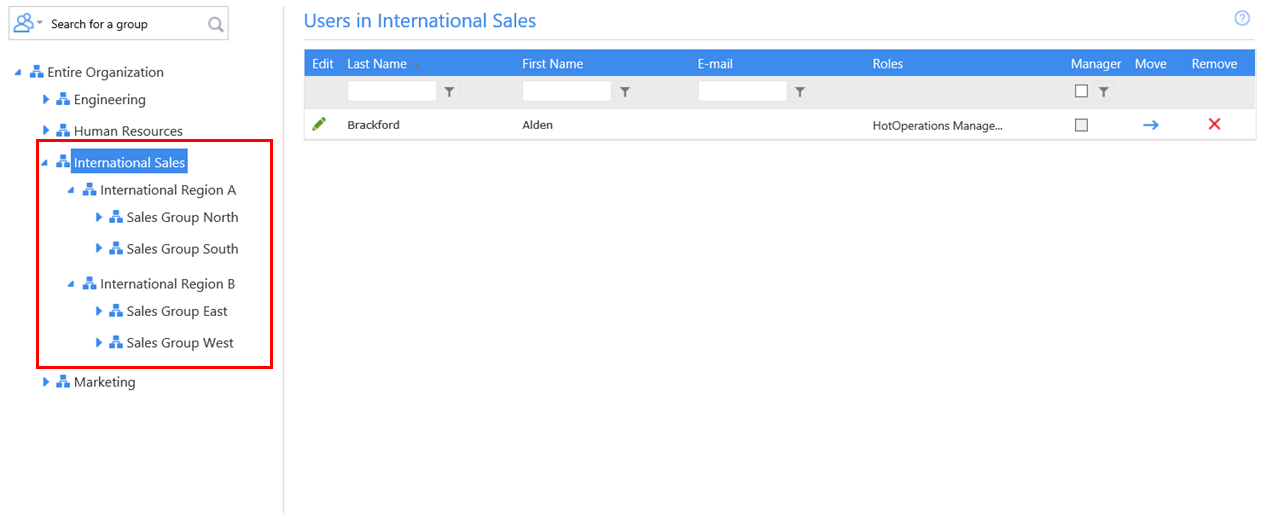
International Sales HotOperations Manager
- International Sales A
- Sales Group North
- Sales Group South
- International Sales B
- Sales Group East
- Sales Group West
International Sales A HotOperations Manager
- Sales Group North
- Sales Group South
International Sales B HotOperations Manager
- Sales Group East
- Sales Group West
Important Notes
- Operations Managers and Team Leaders cannot exist on the same group level.
- There must be at least one sub-group beneath the group level where the operations manager is assigned.
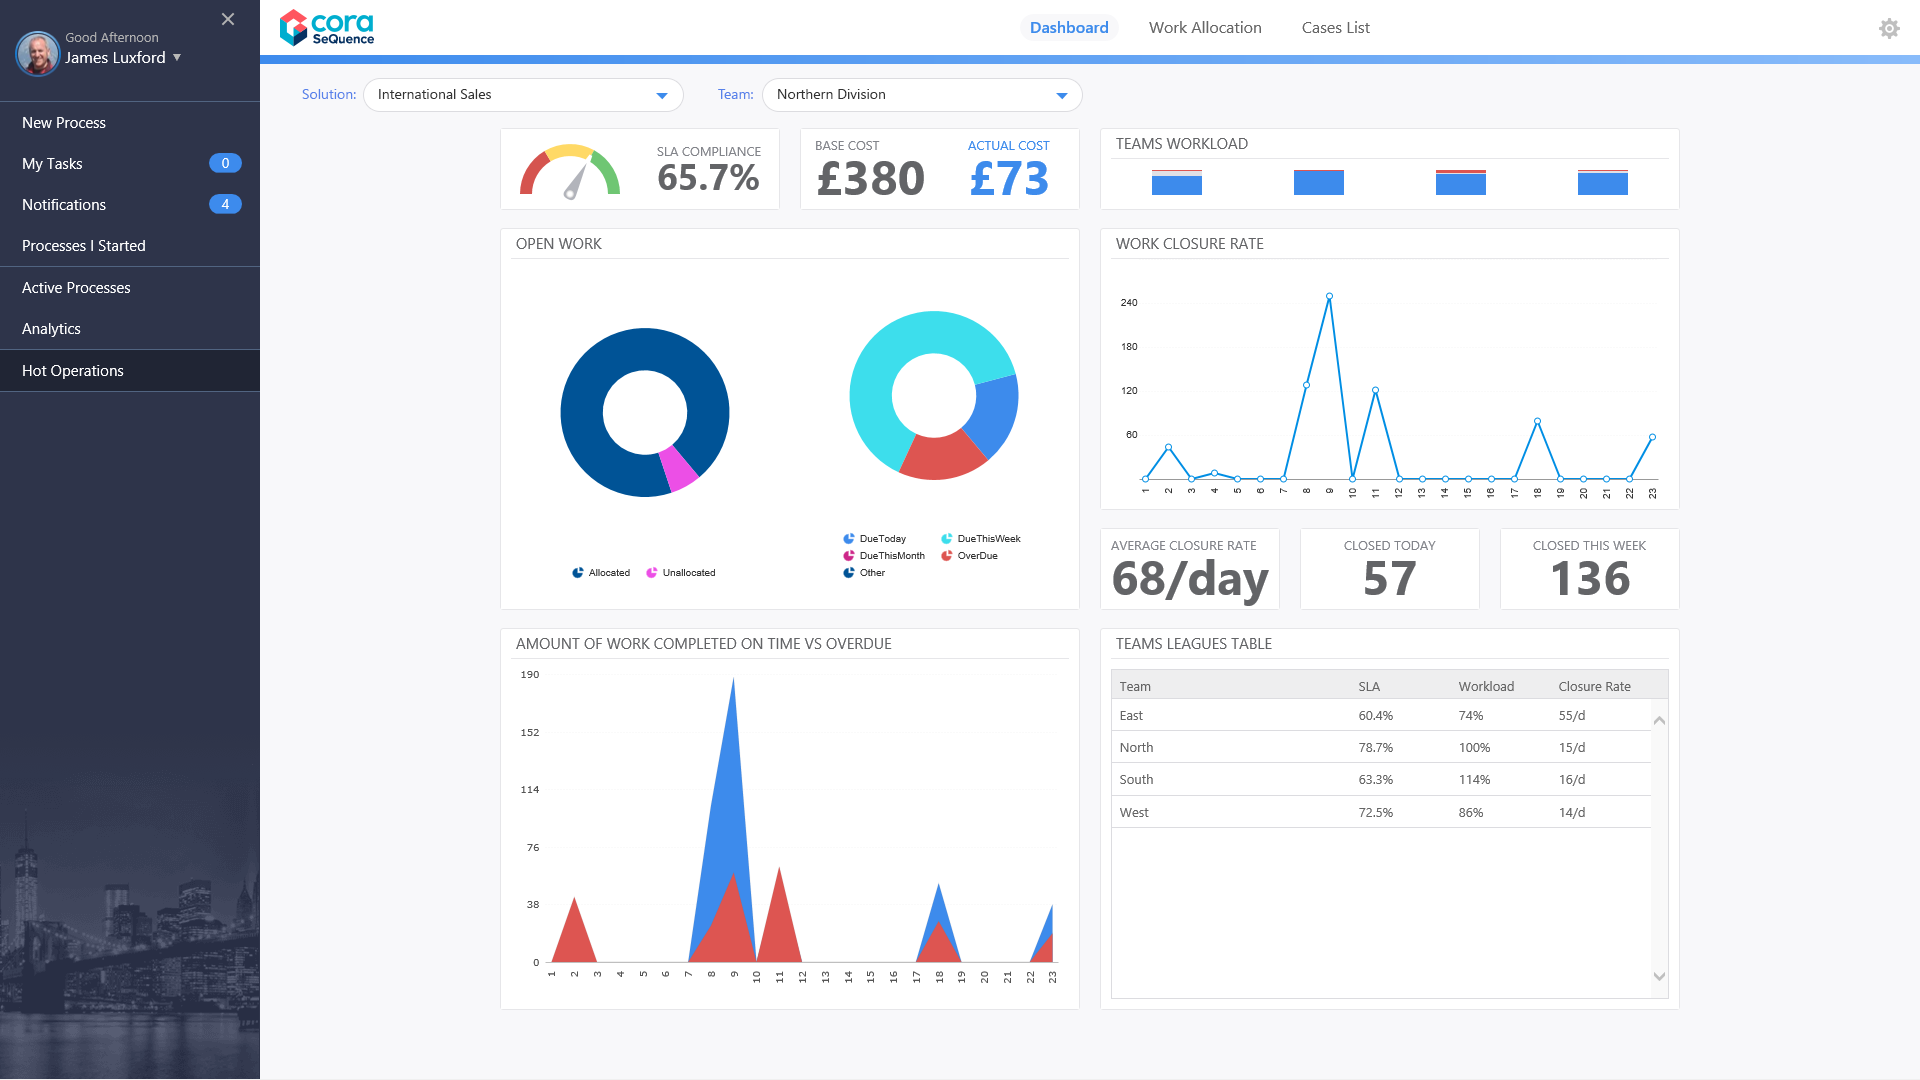
Dashboard
The Dashboard page includes relevant charts and analytics for teams' work performance, and includes the following visuals.
| Visual | Description |
|---|---|
| SLA Compliance | Number of cases that were completed on time, divided by the total number of cases. Displayed as a percentage. |
| Base and Actual Cost | Cost per case, based on the default operation setting (base), and the actual cost per case derived from the team utilization. |
| Team Utilization | How much effort is allocated to a team versus the team's monthly capacity. This is based on the value of the scmCaseEffort parameter. |
| Open Work |
|
| Work Closure Rate | Number of tasks closed every day from the beginning of the period, by category.
|
| Amount of Work Completed versus Overdue | For each day from the beginning of the time period, displays the number of cases that were closed on time versus tasks that were closed after the due date. |
| Teams Leagues Table | Displays information for each team member.
|
Work Allocation Page
Operations managers use the Work Allocation board to allocate cases between teams in real-time. To allocate work, drag-and-drop cases from the Unallocated Work panel to the necessary Team queue, or from team to team. When you drag a case to a different queue, an Impact window appears, which details the allocation impact on business outcomes, such as Cost and SLA. With these tools, Operations Managers can make informed decision on how to allocate case work between teams and people, which reduces the cost of work and improves business outcomes.
Tip: We recommend that you manage less than 25 teams on the Work Allocation page. Managing more cases might affect performance. If you need to manage more teams, use the Cases List or Tasks List.
| Visual | Description |
|---|---|
| SLA Compliance | Number of cases that were completed on time, divided by the total number of cases. Displayed as a percentage. |
| Base Cost | Cost based on the number of hours it should take to complete all cases for the month. |
| Predictive Cost | The predicted cost per month if teams continue to work on the current workload. |
| Teams Workload | The percentage that each team is utilized for case work, out of their available monthly work hours. |

Cases List Page
Operations Managers can view a list of all cases and allocate those cases from the Cases List page. We recommend using the Cases List page when managing high volumes of cases.