Overview
With dashboard filters, users can focus on the most relevant information when analyzing data in Flowtime. You can add filters to new or existing Dashboard Suites.
![]() Watch this video on how to add filters to Analytics dashboard suites.
Watch this video on how to add filters to Analytics dashboard suites.
Add a filter to a Dashboard Suite
You can add as many filters as required to a Dashboard Suite.
- In the Administration page, select Administration>Analytics>Dashboard Suites.
- Locate the dashboard suite to which you want to add filters, and click the edit button.
- On the Dashboard Suite page, click the Filters tab.
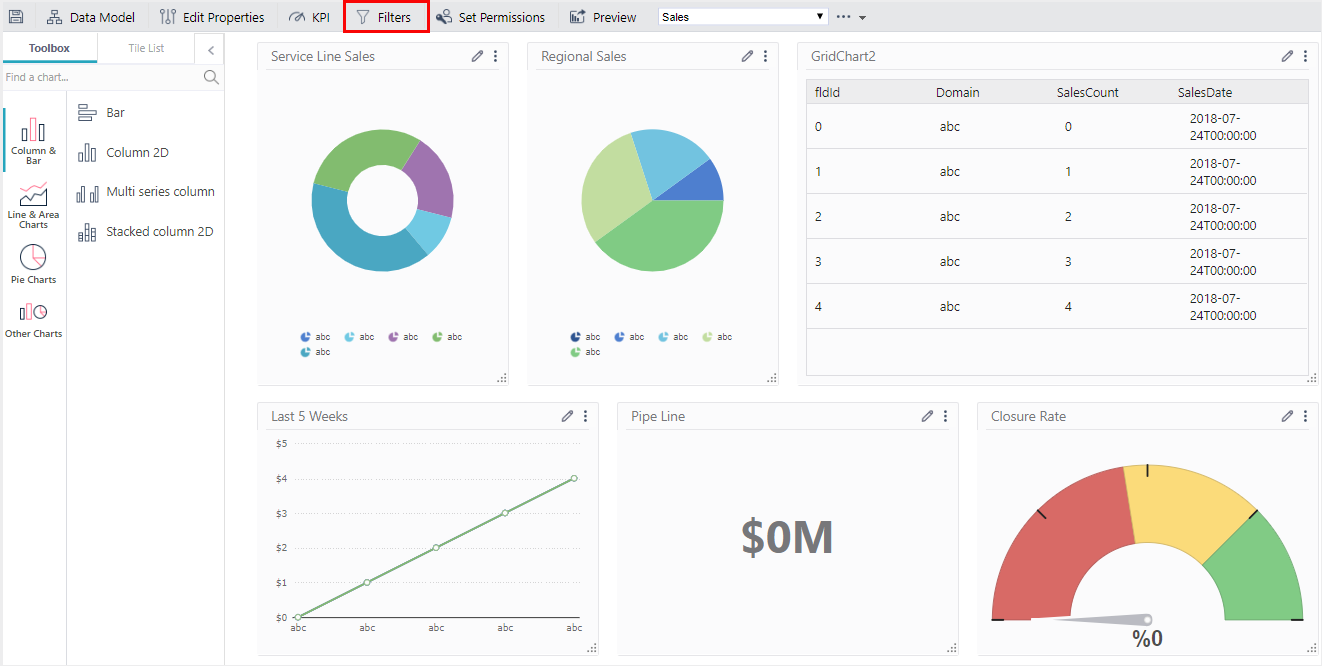
- Click Add Filter, and select the relevant filter type: Combo Box, Date, or Number.
The selected filter is added to the list. - Under Name, enter a name for the filter control.
- Under Label, enter a significant label. This label displays with the filter control in Flowtime.
- To adjust the width of the filter control, edit the Field Width value. The default value is 220 pixels.
- Filter controls are arranged according to the order in which they appear in the list. To reorder the filters, select a filter, and then click the up or down arrows.

Configure filter properties
Each filter type serves a different analytical use, depending on the data provided by the existing dashboards and your organization needs. You need to configure the filter properties accordingly.
Combo Box filter
You can map the Combo Box filter to an existing data source, or enter choices manually.
Note: To set up a Combo Box filter that is mapped to a data source, make sure that there is a dashboard tile already mapped to the relevant data source.
- On the Dashboard Filters screen, click the Properties button (
 ).
). - On the Combo Box Filter Properties screen, do one of the following:
- To create a Combo Box that is mapped to an existing data source:
- In the Choose Tile to Base Data Source on list, select the tile that is already mapped to the required data source.
- From the Data Text Field list, select the field by which you want to filter.
- From the Data Value Field list, select the corresponding value field.
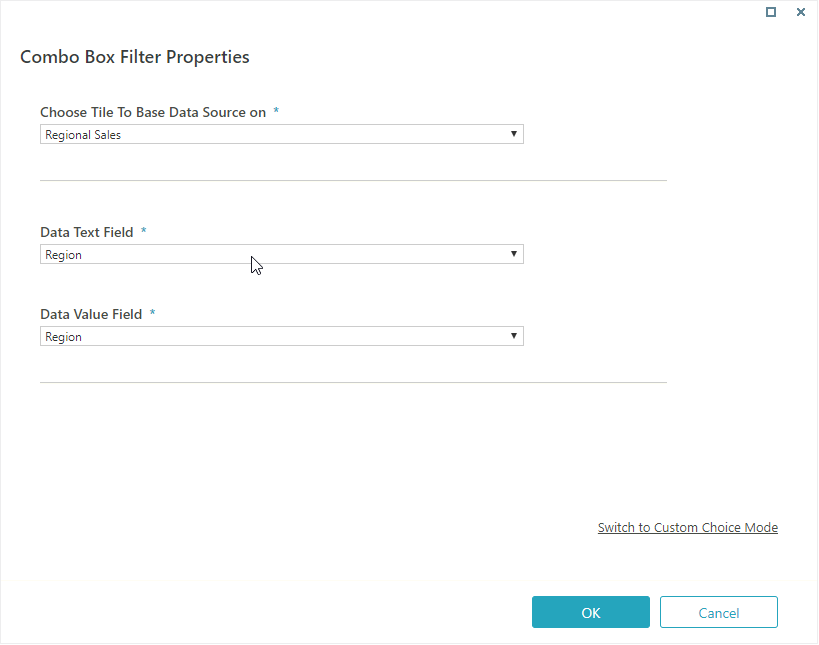 Sample: Defining properties for a Combo Box filter
- To create a custom list of choices:
- Click Switch to Custom Choice Mode.
- Add choices.
- To create a Combo Box that is mapped to an existing data source:
- Click OK.
 ).
).
Important
Currently, the Analytics page on Flowtime does not support combo box filters with fields that include spaces or periods.
Date filter
Define the time period by which the user will be able to filter the data.
- On the Dashboard Filters screen, click the Properties button (
 ).
). - In the Date Filter Type list, select the type that best fits your needs.
- Click OK.

Number filter
Define the number type by which the user will be able to filter the data.
- On the Dashboard Filters screen, click the Properties button (
 ).
). - In the Number Type list, select the type that best fits your needs.
- Click OK.
Connect tile to dashboard filter
After you create the dashboard filter, you need to connect the dashboard filter to a dashboard tile. Dashboard filters can apply to more than one dashboard tile.
- On the dashboard page, locate the tile to which you want to apply the dashboard filter, and click the edit button (
 ).
). - Click the Filters tab.
- On the Filters tab, select Add Filter.
- In the Column list, select a parameter, and then set the required operator.
- In the Source Type list, select Dashboard Filter.
- In the Value/Parameter Name, select the dashboard filter to which you want to connect.
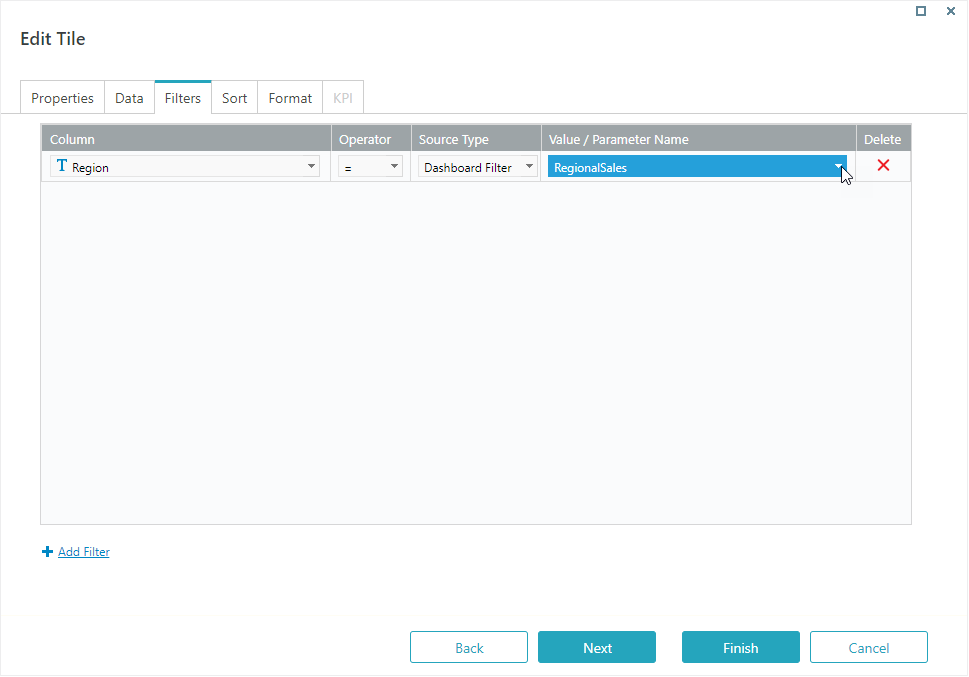 Sample: Connecting a tile to a dashboard filter
Note: Because the date parameter usually includes time (hour, min, sec), for Date type filters, add two filters:
<dateFilterName.To> and <dateFilterName.From>.
This practice ensures that the date filter retrieves data for entire days. - Click Finish.
- To check the filter, click the Preview button.
 ).
).
Set filter control options
Define how the filter control displays in Flowtime.
- On the Dashboard Suite page, click the arrow next to the dashboard name, and then click Options.
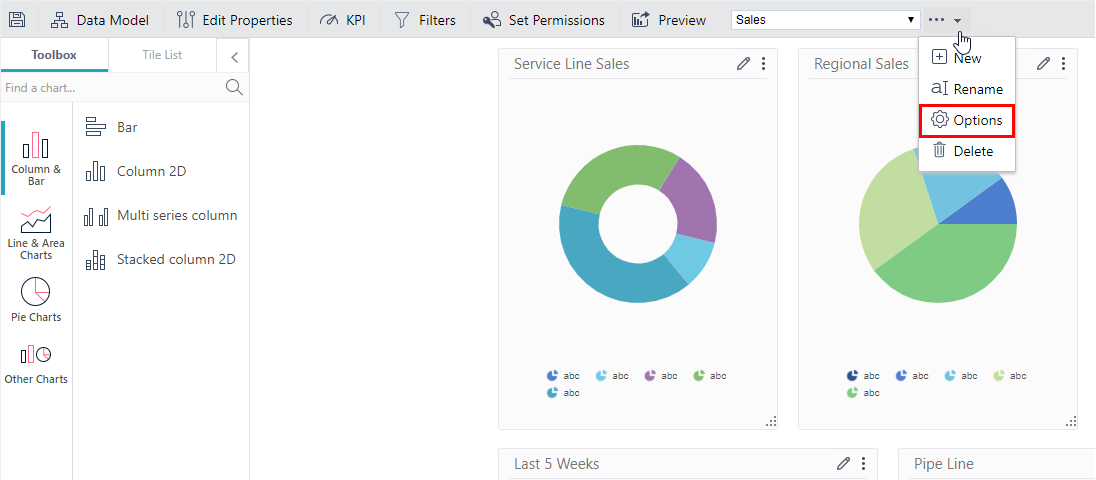
- In the Filter Appearance in Runtime list, select one of the following options:
- Collapsed on entry: User needs to click Show Filters to display the filters.
- Expanded on entry: Filter controls display on top of the Analytics page when the page loads.
- Hidden: Filters don't display on the Analytics page.
- Click OK.

 | Want to learn by doing? Check out this hands-on exercise. Note that only internal users can access the link. |
