Starting with V10.0, Cora SeQuence has been renamed to Cora Orchestration.
V10.3.1 and later
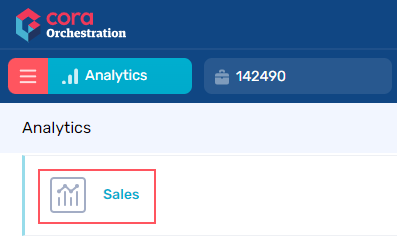
A report in Analytics, enables the user to view the data from a SQL table or view in a grid format, making it easy for the user to sort, filter and save the data.
Prerequisites
Before you create a report, you need to:
- Create a dashboard suite.
- Add the relevant Lookup table to your data model.
Create a new report dashboard
- In the Administration>Analytics>Dashboard Suites, add a new dashboard or edit the dashboard suite to which you want to add a report dashboard.
By default, the newly created dashboard includes a tile with a bar chart. - Delete the default tile with a bar chart.
- In the Toolbox, click Reports>Report.
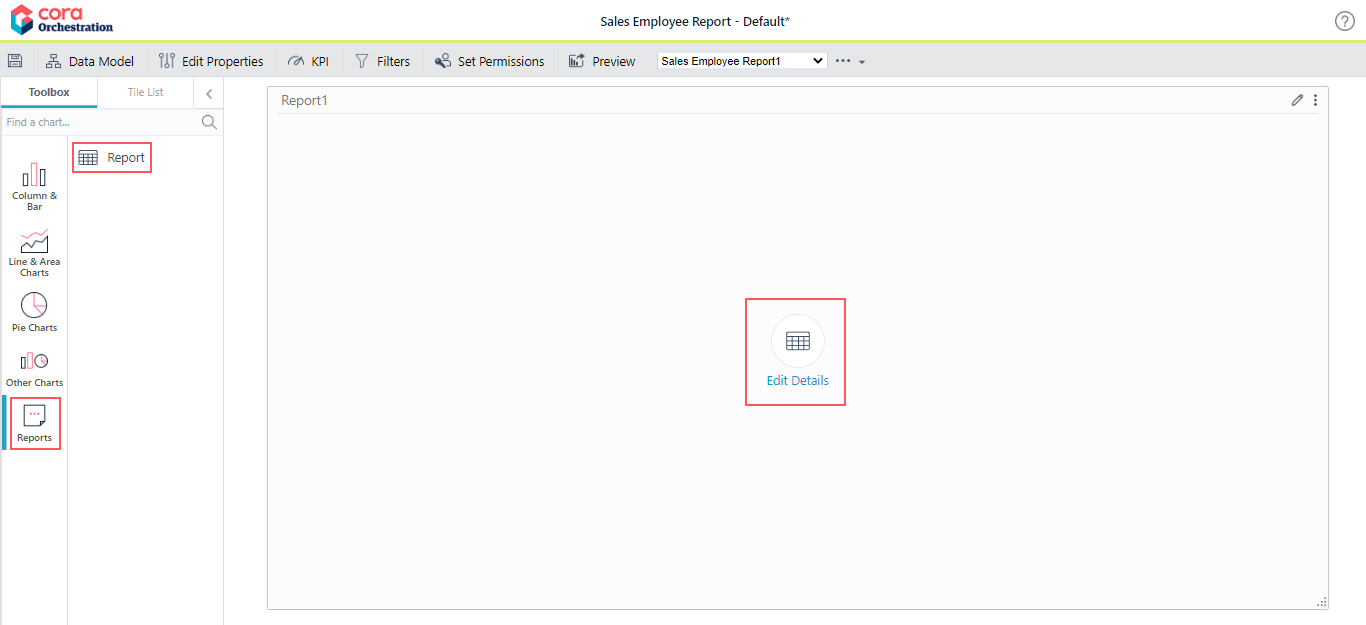
- To edit the report, click Edit Details.
- On the Properties tab:
- Name: Enter a significant name for the report.
- Title: Enter the name to display on top of the report when viewed in the portal.
- Description: Add a short description of the data displayed by the report. This text displays as a tooltip when the report is viewed in the portal.
- Click Next.
- On the Data tab:
- Select Choose Query as <New Query>.
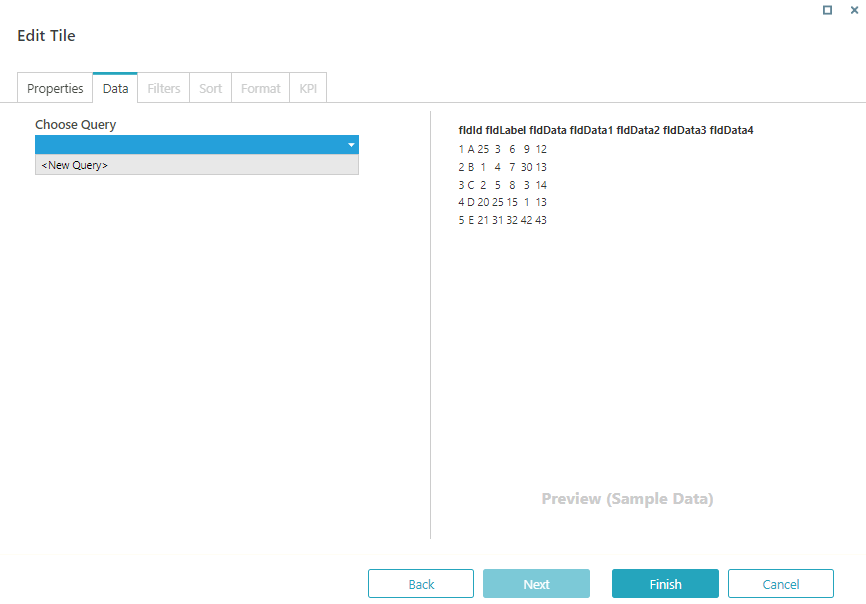
- Click Add>Lookup Table, to add a new Lookup table query as the data source for the report.
In the Lookup Table Properties, select table, and then click Add.
Report dashboard works with Lookup table data source only. - To define cache settings for the selected query, click Advanced Options.
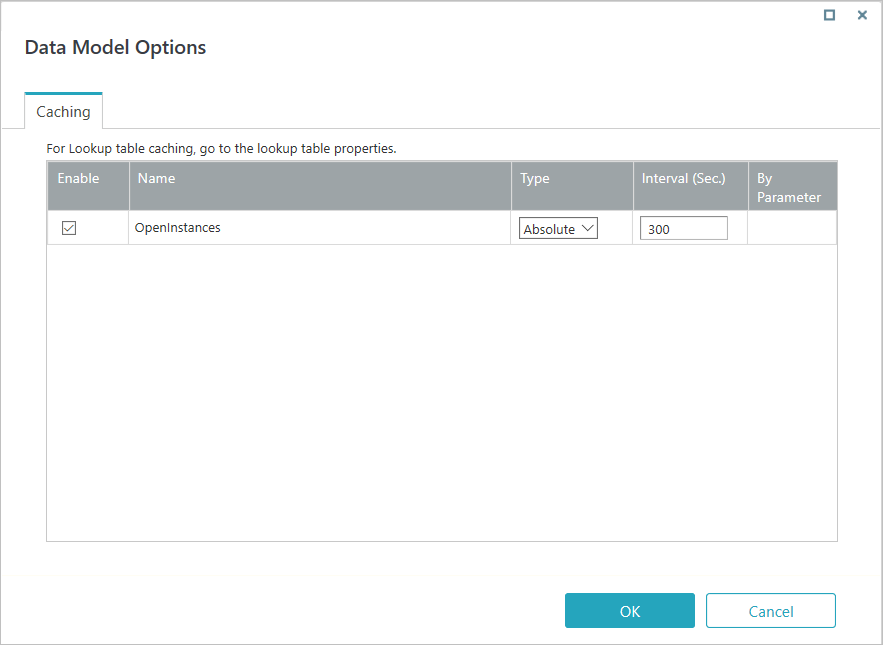 For more information on defining cache settings, see this article.
- Select Choose Query as <New Query>.
- On the Format tab, configure the report columns.
For example and details, see the Configure report columns section below. - Click Finish.


 For more information on defining cache settings, see
 NOTE
- The Report tile is intended to be used as a single tile in the canvas. With Report tile you can't add any other tile to the dashboard.
- You can add only one Report tile to a dashboard.
- For report dashboard, Preview is not supported.
- You can resize a dashboard and drag it to a different location.
The dashboard is responsive and automatically adjusts to the display, but there is no absolute position.
Configure report columns
You can configure the report columns per your need while configuring the report tile in the dashboard. Edit the report tile, and in the Format tab add the column settings.
Example 1
For configuring the date format, use the sample below:
{
  "columns": [
    {
      "field": "actCreationDate",
      "definitions": {
        "width": 100,
        "title": "Act Creation Date",
        "template": "<span>#=kendo.toString(data.actCreationDate,'G')#</span>"
      }
    }
  ]
}
More date format options, see this link.
Example 2
To change the Case ID field you need to change the fldId field value, as shown in sample below:
{
  "columns": [
    {
      "field": "fldId",
      "definitions": {
        "width": 100,
        "title": "ID",
        "template": "<a href=javascript:$ft('\\##=data.elementId#').AnalyticsDataGrid('instance').openItem('/_layouts/runtime.aspx?workflowInstanceId=#=data.fldId#','#=data.fldId#','Case ID #=data.fldId#')>#=data.fldId#</a>"
      }
    }
  ]
}
If no columns are specified, then the default for ‘fldId’ (field must exist) is following:
<a href=javascript:$ft('\\##=data.elementId#').AnalyticsDataGrid('instance').openItem('/_layouts/runtime.aspx?workflowInstanceId=#=data.fldId#','#=data.fldId#','Case ID #=data.fldId#');>#:data.fldId#</a>NOTE
- To view the list of column properties that you can configure, see this link.
- You can configure a template to open any link with any row data. To view the list of supported kendo templates syntax, see this link.
- To view list of supported formatting, see this link.
- You can extend the AnalyticsDataGrid in portal, and call your own function with your data.
- Data row context is available at 'data' object.
Dashboard filter appearance and canvas width
You can add default settings for the appearance of the dashboard in the portal in runtime. The canvas width for report dashboard is 100% by default, and can't be changed.
- Click the ellipsis next to the dashboard name drop down, and the click Options.
- In the Dashboard options pop-up window:
- Select Filter Appearance in Runtime:
- Collapsed on entry: To display the report in collapsed form by default in runtime. You can then expand the report to view.
- Expanded on entry: To display the report in expanded form by default.
- Hidden: To hide the report by default in runtime.
- Select Filter Appearance in Runtime:
- Click OK.

Create a report to view from an external link (V10.4 onwards)
The external link report in Analytics enables the user to view reports from any external link in a tab in the portal.
NOTE
The external link report supports only the URLs that can be shown in an iFrame control.
- In the Administration>Analytics>Dashboard Suites, add a new dashboard or edit the dashboard suite to which you want to add a report dashboard.
By default, the newly created dashboard includes a tile with a bar chart. - Delete the default tile with a bar chart or any tile already in the dashboard.
- In the Toolbox, click Reports>External Link.
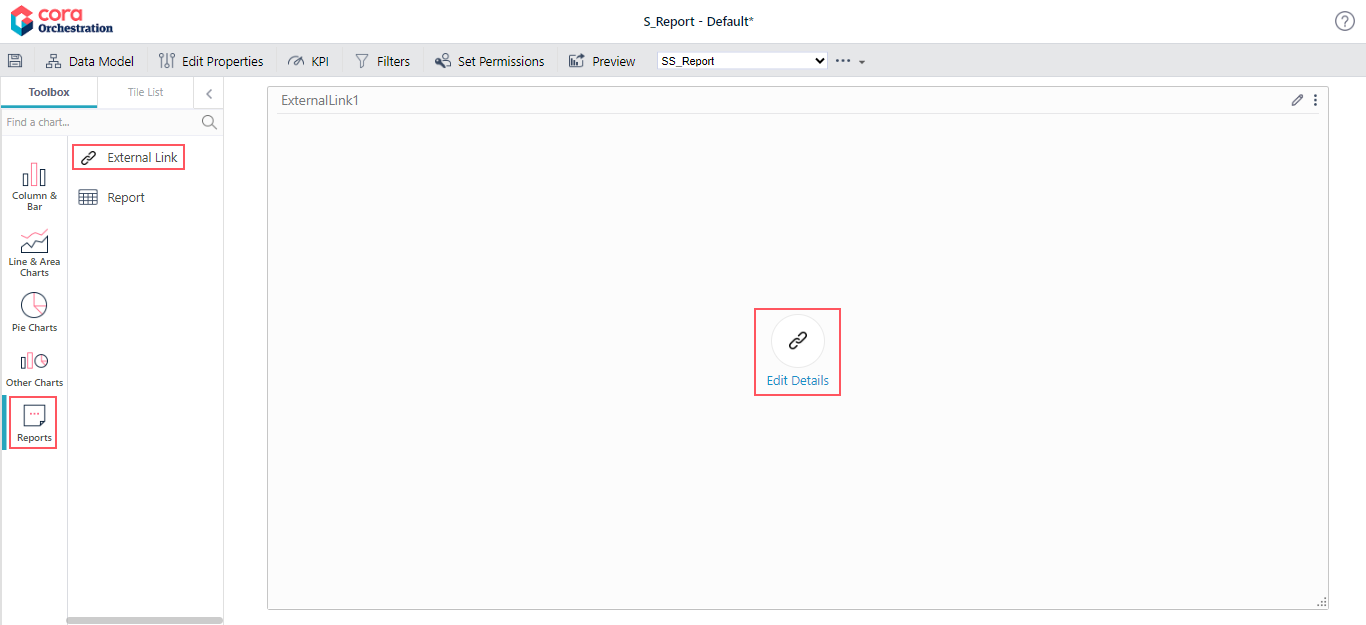
- To edit the report, click Edit Details.
- On the Properties tab, add the following:
- Name: Enter a significant name for the report.
- Title: Enter the name to display on top of the report when viewed in the portal.
- Description: Add a short description of the data displayed by the report. This text displays as a tooltip when the report is viewed in the portal.
- Click Next.
- On the Content tab, add the JSON code with the external link and other report configurations.
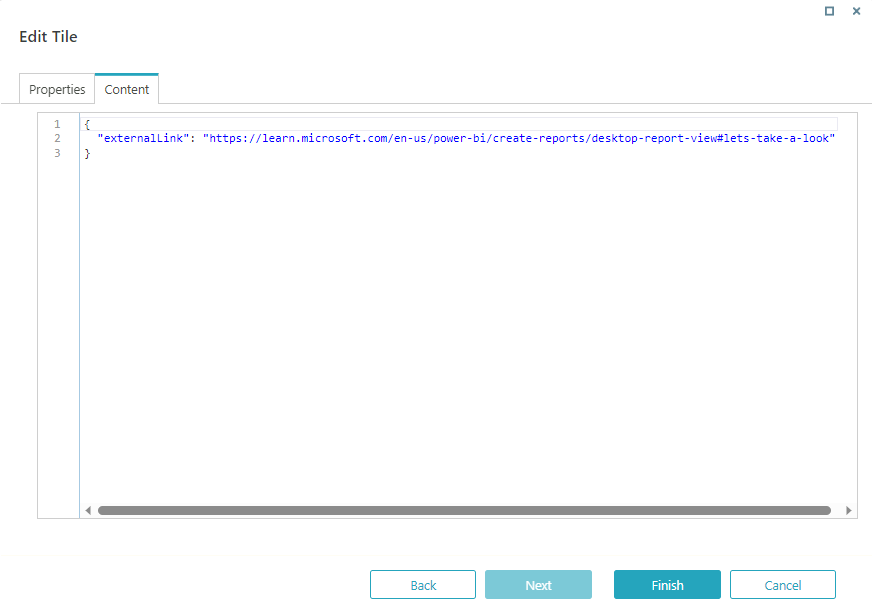
- Click Finish.


Add icon to dashboards (V10.5 onwards)
Starting from V10.5, you can add icons to your reports and dashboards. With added icons you can easily identify your reports and dashboards even with similar names.
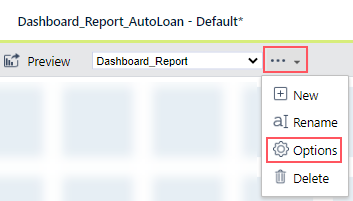
- Click the ellipsis next to the dashboard name drop down, and the click Options.
- Click Select Icon, in the Dashboard options pop-up window, and choose from the list the icon you want to set.
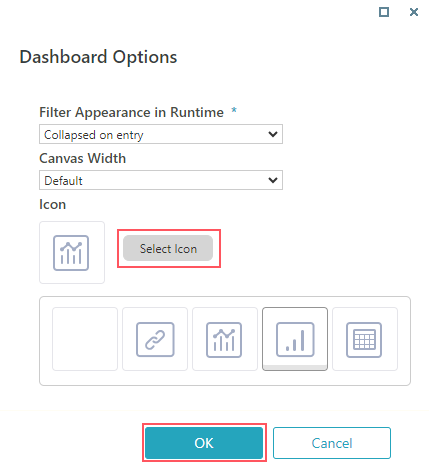
- Click OK.

The icon appears next to the report name on the Analytics page in the portal.